Access Grafana
Out of the box, the HPE Machine Learning Inferencing Software controller provides a default Grafana dashboard that displays metrics for the HPE Machine Learning Inference Software deployments. You can use Grafana to monitor the performance of your deployments and services.
Before You Start #
- Ensure you have access to the HPE Machine Learning Inferencing Software controller.
- Familiarize yourself with Grafana and its features.
How to Access Grafana #
With SSO #
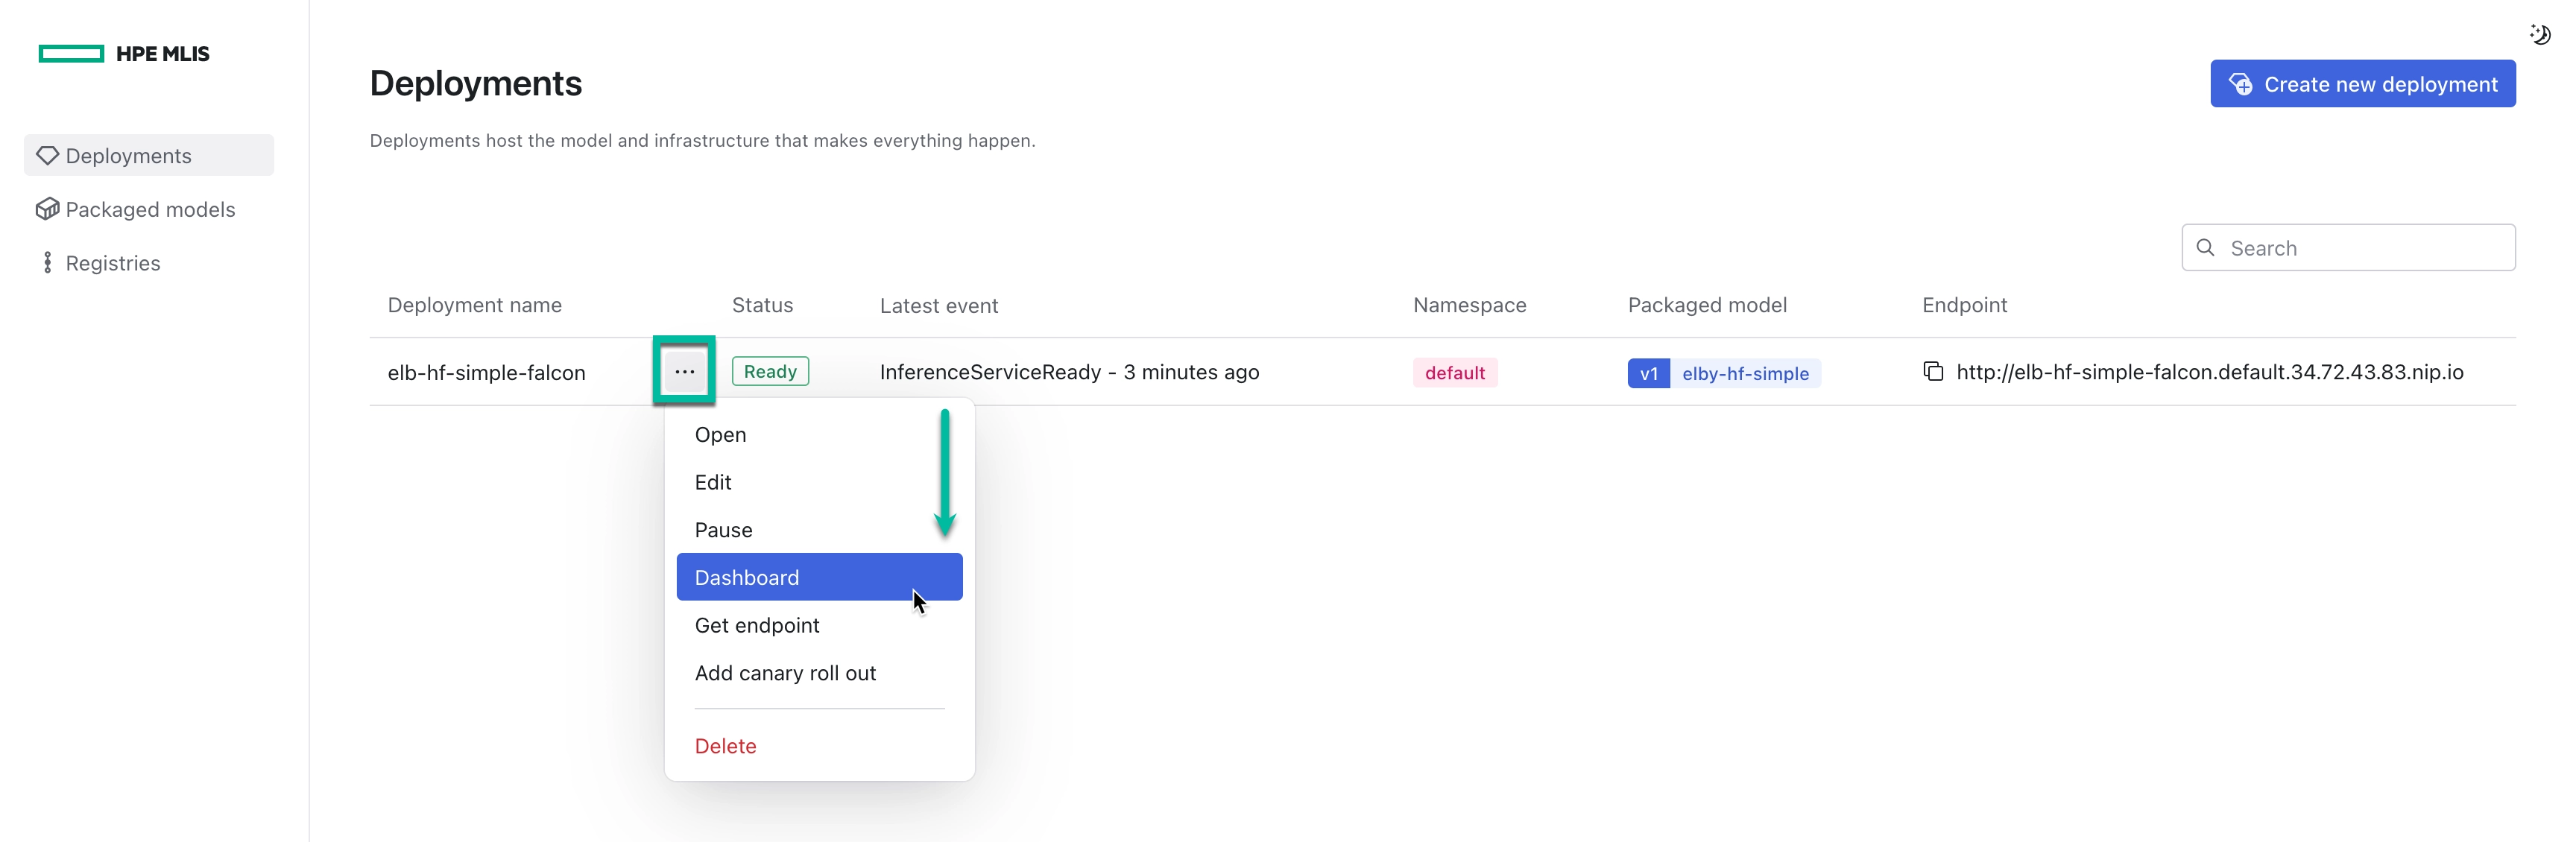
- Navigate to Deployments.
- Select the ellipsis icon for the deployment you want to monitor.
- Select Open dashboard.
Without SSO #
- Obtain the Grafana Admin user password by running the following command:
kubectl get secret aioli-grafana -o jsonpath="{.data.admin-password}" | base64 --decode ; echo - Open a web browser and navigate to the
/grafanaendpoint of the Controller. - Log in with the default credentials:
- Username:
admin(default) - Password:
<PASSWORD>
- Username:
- Navigate to Dashboards > HPE Machine Learning Inference Software Deployment Dashboard.