View Metrics (Prometheus)
HPE Machine Learning Inferencing Software facilitates access to metrics generated by the underlying components used in your deployed model services (e.g., Kubernetes, KServe, BentoML, OpenLLM, and NIM). These components provide numerous metrics out of the box. The specific metrics available for your deployment depend on the type of model you deploy and the configuration of your system.
Before You Start #
Review the following information before you start:
- All containers get Kserve and Knative metrics.
- Any metrics surfaced via
/metricson the container port (8080) are also collected. - MLIS does not generate any metrics of its own.
How to View Metrics #
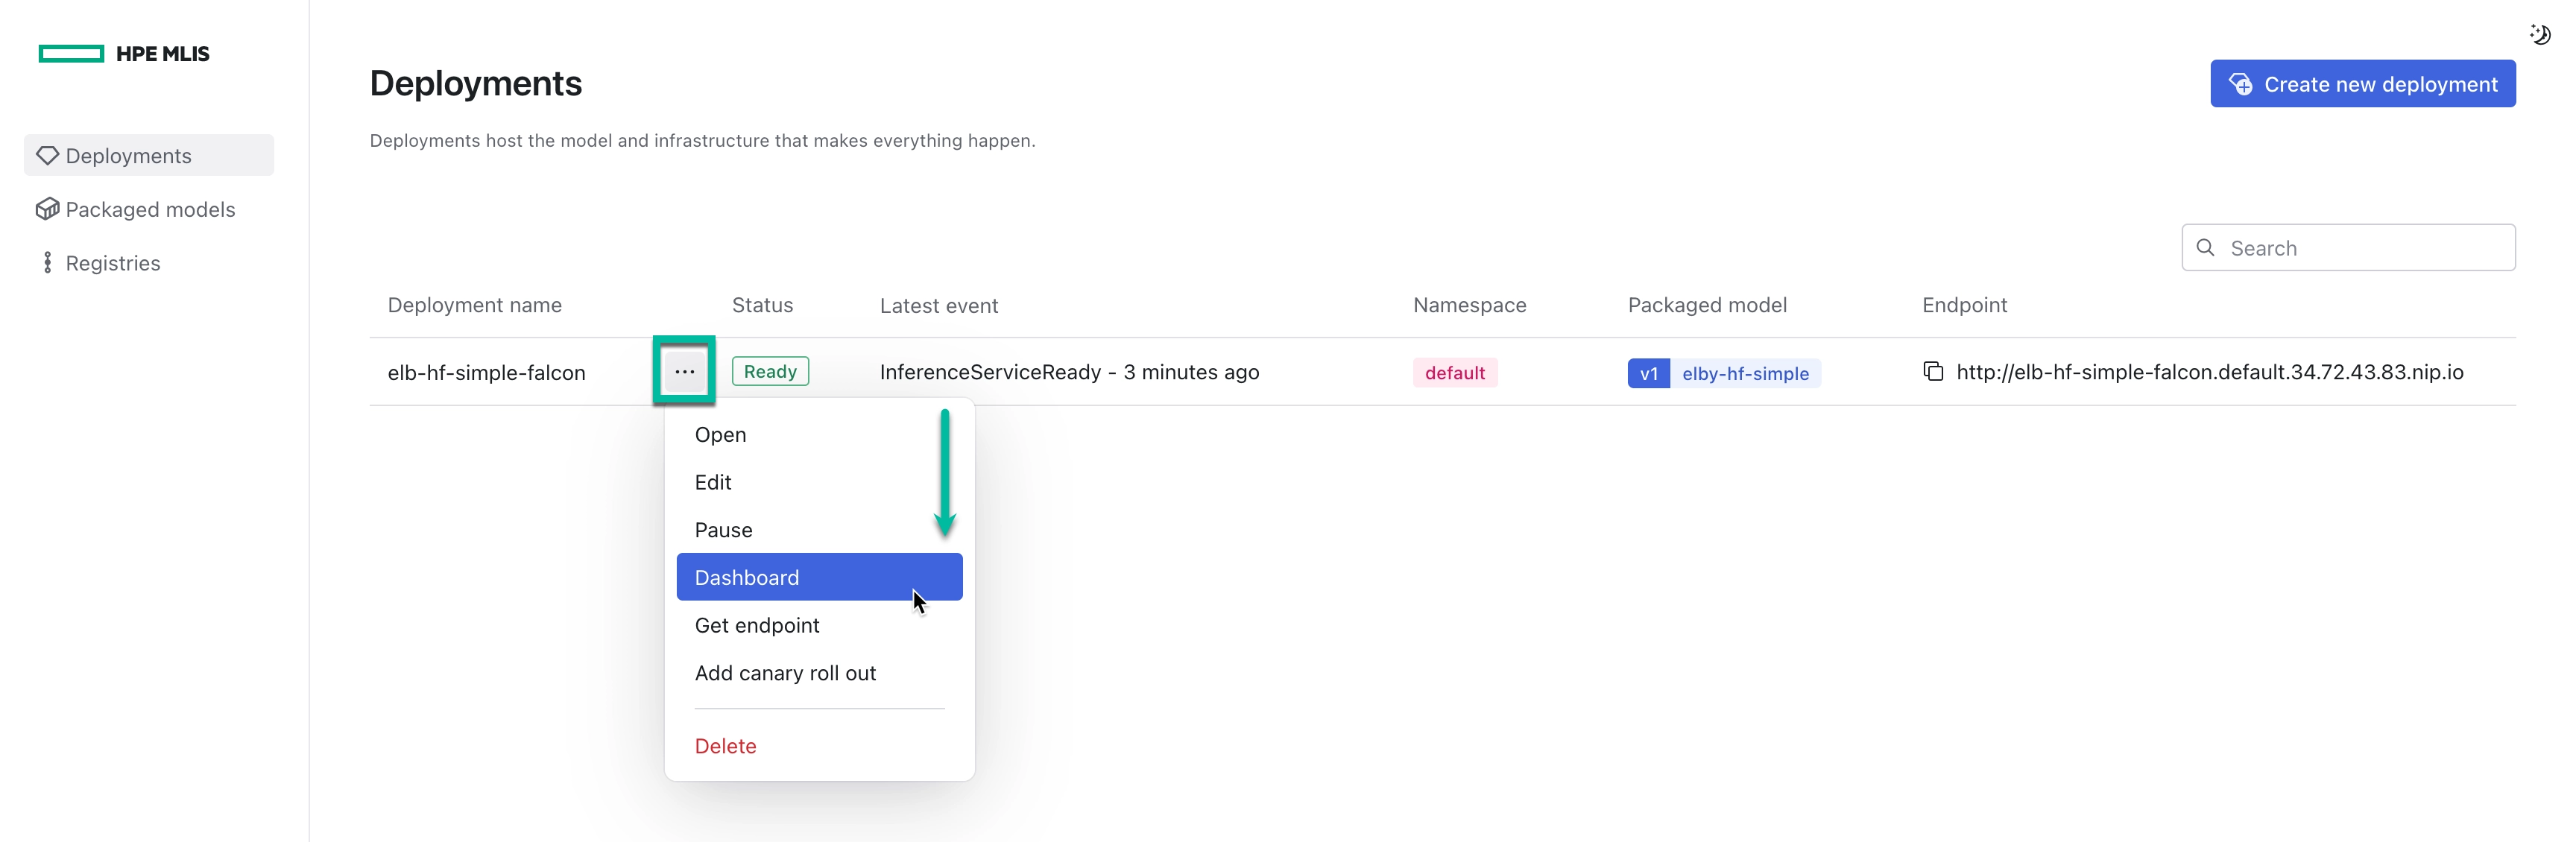
- Navigate to the Deployments dashboard.
- Select the Ellipsis icon for the deployment you want to monitor.
- Select th Dashboard option. A new browser tab opens with the Grafana dashboard for the selected deployment. By default, all packaged model versions are displayed.
- Navigate to Explore.
- Select the Prometheus data source.
- In the Select label dropdown, select one of the following Label names:
Label Name Value Description serving.kserve.io/inferenceserviceThe deployment name. Selects all instances of all versions of your inference service. Selectable in the Deployment Dashboard via the Deployment Namedropdown.inference/packaged-modelThe packaged model name and version. For example: fb125m-model.v1Selectable in the Deployment Dashboard via the Packaged Model Versiondropdown. By default, all versions of the deployment are shown.inference/deployment-idThe deployment’s idvalue.For advanced use. Normally serving.kserve.io/inferenceserviceis used as long as deployment names are not reused for different instances.inference/packaged-model-idThe packaged model’s idvalue.For advanced use. Normally inference/packaged-modelis used as long as packaged model names are not reused for different instances. Can't find a label?
If you can’t find any of the mentioned labels while building a query, it’s likely because the time range selected doesn’t have any data for that label. Try expanding the time range. - In the Select value dropdown, select the corresponding value that matches your deployment or packaged model.
- Continue building your query as needed.
- Select Run Query.
Metrics #
BentoML & OpenLLM #
The following table lists some metrics that are commonly useful when monitoring BentoML and OpenLLM deployments.
- For more information on BentoML metrics, see the official documentation.
- For details about metrics provided by the vLLM backend of BentoML and OpenLLM, see the vLLM documentation.
| Description | Metric Name | Metric Type | Dimensions |
|---|---|---|---|
| API Server request in progress | bentoml_api_server_request_in_progress |
Gauge | endpoint, service_name, service_version |
| Runner request in progress | bentoml_runner_request_in_progress |
Gauge | endpoint, runner_name, service_name, service_version |
| API Server request total | bentoml_api_server_request_total |
Counter | endpoint, service_name, service_version, http_response_code |
| Runner request total | bentoml_runner_request_total |
Counter | endpoint, service_name, runner_name, service_version, http_response_code |
| API Server request duration in seconds | bentoml_api_server_request_duration_seconds_sum, bentoml_api_server_request_duration_seconds_count, bentoml_api_server_request_duration_seconds_bucket |
Histogram | endpoint, service_name, service_version, http_response_code |
| Runner request duration in seconds | bentoml_runner_request_duration_seconds_sum, bentoml_runner_request_duration_seconds_count, bentoml_runner_request_duration_seconds_bucket |
Histogram | endpoint, service_name, runner_name, service_version, http_response_code |
| Runner adaptive batch size | bentoml_runner_adaptive_batch_size_sum, bentoml_runner_adaptive_batch_size_count, bentoml_runner_adaptive_batch_size_bucket |
Histogram | method_name, service_name, runner_name, worker_index |
KServe & Knative #
See the Knative observability documentation for more information on metrics that can be made available for your deployment.
NIM #
Some Nvidia NIM containers also provide metrics, such as the llama3 container—however, other reranking and embedding NIMs currently do not. See the official documentation for details.